This is a fully functional example of a MADSci-powered self-driving laboratory. It demonstrates the complete MADSci ecosystem including all core managers, multiple virtual laboratory nodes, and various workflows that showcase autonomous experimentation capabilities.
Currently, this lab uses simulated example modules for purely fake devices. For examples of real equipment integrated using MADSci, see here.
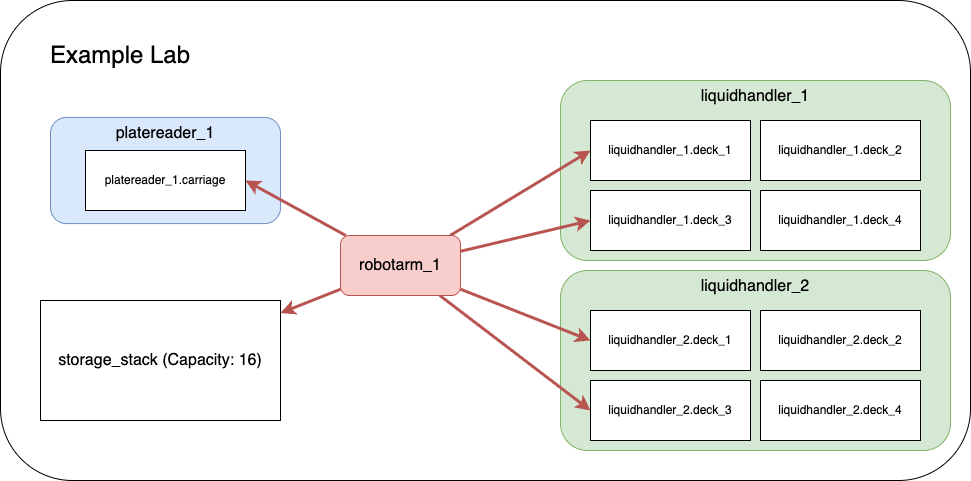
Lab Architecture
The example lab simulates a real laboratory environment with:
Infrastructure Services
FerretDB (Port 27017): Document database for event and experiment data (MongoDB-compatible, backed by PostgreSQL)
PostgreSQL (Port 5432): FerretDB backend database
PostgreSQL (Port 5434): Resource Manager relational database
Valkey (Port 6379): Real-time state management and caching
SeaweedFS (Port 8333/9333): S3-compatible object storage for data files
Core Managers
Lab Manager (Port 8000): Central dashboard and lab coordination
Event Manager (Port 8001): Distributed event logging and monitoring
Experiment Manager (Port 8002): Experimental runs and campaign management
Resource Manager (Port 8003): Laboratory resource and inventory tracking
Data Manager (Port 8004): Data capture, storage, and querying
Workcell Manager (Port 8005): Workflow coordination and scheduling
Location Manager (Port 8006): Laboratory location management and resource attachments
Laboratory Nodes
liquidhandler_1 (Port 2000): First liquid handling robot
liquidhandler_2 (Port 2001): Second liquid handling robot
robotarm_1 (Port 2002): Robotic arm for material transfer
platereader_1 (Port 2003): Plate reader for measurements
advanced_example_node (Port 2004): Advanced node demonstrating complex workflows
sila_example_server (Port 50052): Minimal SiLA2 server demonstrating the experimental
SilaNodeClient(consumed viasila://localhost:50052). See SiLA Example Server below.
Prerequisites
Before starting the example lab, ensure you have:
Docker: Docker Desktop or Rancher Desktop
Docker Compose v2.0 or higher
At least 4GB RAM allocated to Docker
At least 10GB free disk space
Consult the Docker Guide for configuration and setup recommendations
Network Requirements:
Ports 2000-2004, 5432, 5434, 6379, 8000-8006, 8333, 9333, 27017, and 50052 available
Internet access for pulling Docker images
System Requirements:
Linux, macOS, or Windows with WSL2
x86_64 or arm64 architecture
Quick Start
If you’re new to docker/docker compose, we recommend consulting our Docker Guide before jumping in.
1. Start the Example Lab
From the root of the MADSci repository:
# Start all services
docker compose up

# Or start in detached mode (runs in background)
docker compose up -d

# View logs if running detached
docker compose logs -f
2. Verify Lab Status
Once all services are running (this may take 1-2 minutes), verify the lab is operational:
# Check service health
docker compose ps

# Verify managers are responding
curl http://localhost:8000/health  # Lab Manager
curl http://localhost:8001/health  # Event Manager
curl http://localhost:8002/health  # Experiment Manager
curl http://localhost:8003/health  # Resource Manager
curl http://localhost:8004/health  # Data Manager
curl http://localhost:8005/health  # Workcell Manager
curl http://localhost:8006/health  # Location Manager

# Check node status
curl http://localhost:2000/health  # liquidhandler_1
curl http://localhost:2001/health  # liquidhandler_2
curl http://localhost:2002/health  # robotarm_1
curl http://localhost:2003/health  # platereader_1
curl http://localhost:2004/health  # advanced_example_node

# SiLA example server uses gRPC, not HTTP — verify with a TCP probe instead:
python -c "import socket; s=socket.socket(); s.settimeout(2); s.connect(('localhost', 50052)); print('sila_example_server reachable')"
3. Access the Dashboard
Open your browser and navigate to: http://
The dashboard provides:
Real-time lab status monitoring
Node management and control
Workflow execution interface
Data visualization tools
System health monitoring
Configuration
This lab uses the modern dual-layer configuration pattern:
settings.yamlcontains default, non-secret configuration (server URLs, database names, manager metadata, and structural data references). This file is version-controlled and self-documenting..envcontains secrets and environment-specific overrides (database credentials, OTEL settings). This file is gitignored.Environment variables override both files with the highest precedence.
Structural data is split between settings.yaml and standalone config files:
| Source | Purpose |
|---|---|
settings.yaml → location_transfer_capabilities | Transfer templates and routing configuration |
settings.yaml → resource_default_templates | Default resource templates (plate_nest, storage_stack) |
settings.yaml → workcell_nodes | Node name → URL map for the workcell |
locations.yaml (LabLocationConfig) | Lab-managed locations, location templates, training entries |
Node intrinsic_locations | Locations declared by nodes (e.g., liquid handler deck slots, plate carriage) |
See Configuration.md for the full configuration reference.
Node Configuration
Nodes are configured via environment variables in compose.yaml (NODE_NAME, NODE_MODULE_NAME, NODE_URL). These can also be set in per-node settings.yaml files for local development. Node modules are implemented in example_modules/.
If you are migrating from the legacy *.manager.yaml / *.node.yaml definition-file pattern, see Migration from Definitions.
Usage Examples
Running Workflows
The example lab includes several pre-configured workflows demonstrating different capabilities:
1. Simple Transfer Workflow
# Execute a basic resource transfer between liquid handlers
python -c "
from madsci.client.workcell_client import WorkcellClient
client = WorkcellClient()
result = client.start_workflow('workflows/simple_transfer.workflow.yaml')
print(f'Workflow result: {result}')
"
2. Multi-step Transfer Workflow
# Execute a complex workflow with multiple steps
python -c "
from madsci.client.workcell_client import WorkcellClient
client = WorkcellClient()
result = client.start_workflow('workflows/multistep_transfer.workflow.yaml')
print(f'Workflow result: {result}')
"
3. Minimal Test Workflow
# Run a simple test to verify lab functionality
python -c "
from madsci.client.workcell_client import WorkcellClient
client = WorkcellClient()
result = client.start_workflow('workflows/minimal_test.workflow.yaml')
print(f'Workflow result: {result}')
"
Interactive Learning
Comprehensive Jupyter notebooks are available in the examples/notebooks/ directory:
experiment
_notebook .ipynb - Experiment Development Tutorial node_notebook.ipynb - Node Development Tutorial
backup
_and _migration .ipynb - Backup & Migration Tutorial example
_utilization _plots .ipynb - Utilization Visualization sila
_node _notebook .ipynb - (Experimental) Consuming a SiLA2 device via SilaNodeClient
Start the notebooks:
# Local Jupyter installation
cd examples/notebooks/
jupyter lab

# Or use Docker environment
docker compose exec lab_manager jupyter lab --ip=0.0.0.0 --port=8888 --no-browser --allow-root
# Then open http://localhost:8888 in your browser
Direct Node Interaction
Interact directly with individual nodes:
# Get node status
curl http://localhost:2000/status

# Execute a node action
curl -X POST http://localhost:2000/actions/prepare \
  -H "Content-Type: application/json" \
  -d '{"parameters": {}}'

# Query node capabilities
curl http://localhost:2000/info
Troubleshooting
Common Issues
Services Won’t Start
# Check Docker status
docker --version
docker compose --version

# Verify port availability
netstat -tuln | grep -E '(8000|8001|8002|8003|8004|8005|8006|2000|2001|2002|2003|2004|5432|5434|6379|27017|8333|9333|50052)'

# Check Docker resources
docker system df
docker system prune  # Clean up if needed
Database Connection Errors
# Reset database volumes
docker compose down -v
docker compose up

# Check database logs
docker compose logs postgres
docker compose logs madsci_ferretdb
docker compose logs madsci_valkey
Node Communication Issues
# Check node logs
docker compose logs liquidhandler_1
docker compose logs robotarm_1
docker compose logs platereader_1

# Verify node registration
curl http://localhost:8000/api/nodes

# Check workcell manager status
curl http://localhost:8005/status
For more troubleshooting guidance, see the Troubleshooting Guide.
Observability Stack
The example lab includes optional OpenTelemetry observability with distributed tracing, metrics, and log aggregation:
# Start with full observability stack (Jaeger, Prometheus, Loki, Grafana)
# Run from the repository root:
docker compose --profile otel up
Access the UIs:
| Service | URL | Description |
|---|---|---|
| Grafana | http:// | Unified dashboards (admin/admin) |
| Jaeger | http:// | Distributed tracing UI |
| Prometheus | http:// | Metrics querying |
See the Observability Guide for detailed setup and configuration.
Next Steps
Explore the notebooks: Run through the experiment notebook for hands-on experience
Try different workflows: Execute the various workflow examples in
workflows/Modify configurations: Experiment with
settings.yamland.envDevelop custom nodes: See the Node Development Guide
Build custom workflows: See the Workflow Development Guide
Related Documentation
Node Development Guide - Production deployment patterns and quick reference
Workflow Development Guide - Workflow schema and advanced patterns
Observability Guide - OpenTelemetry stack setup
Troubleshooting Guide - Comprehensive problem-solving guide
Configuration.md - Complete configuration reference
Main README - MADSci overview and installation
Logging Guide - Structured logging and context management
Location Templates
The example lab demonstrates the location template system for declarative location management.
Node-Defined Representation Templates
Both RobotArmNode and LiquidHandlerNode define location_representation_templates with JSON Schema definitions:
robotarm_deck_access/robotarm_wide_access-- defined inexample_modules/robotarm.py. Specify joint positions, gripper configuration, and payload limits. Thepositionfield is a required override (varies per physical location).lh_deck_repr-- defined inexample_modules/liquidhandler.py. Specifies deck slot number, deck type, and plate capacity. Thedeck_positionfield is a required override.
These templates are registered with the Location Manager automatically at node startup via template_handler().
Lab Config File (locations.yaml)
The locations.yaml file is a reconcilable LabLocationConfig document the Location Manager processes on each reconciliation cycle. It defines:
Location templates -- e.g.,
storage_rack_nest(reusable blueprints for lab-managed locations).Training -- adds node representations to existing node-managed locations (e.g., teaching
robotarm_1how to access specific liquid handler deck slots).Lab-managed locations -- e.g.,
storage_rack, locations not owned by any single node.
Node-intrinsic locations (liquid handler deck slots, plate reader carriage) are declared via each node’s intrinsic_locations ClassVar and auto-created at node startup; they do not need to appear in locations.yaml.
Dashboard Integration
Once the lab is running, navigate to the Locations tab in the dashboard at http://
View all locations with their representations and template lineage
Create new locations from registered templates, selecting node bindings and filling in required overrides via schema-aware forms
Edit representations on existing locations
See the Location Templates Guide for full documentation.
SiLA Example Server (Experimental)
Status: Experimental. The
SilaNodeClientand thesila_example_servership as a preview of native SiLA2 integration. The client surface, the example server’s Feature shape, and the install path may change. The broader migration is scoped inopenspec/changes/sila2-native-node-design/(project umbrella: issue #293).
The example lab includes a minimal SiLA2 server (example_modules/sila_example_server/) that demonstrates how to consume a SiLA2-based device from MADSci using SilaNodeClient. It exposes one Feature, ExampleDevice, with:
Greet— unobservable command (synchronous).CountDown— observable command (long-running, with intermediate progress).GenerateData— returns binary data, surfaced asActionFileson the client side.ServerUptime— typed Property.
The compose service runs the server on 0.0.0.0:50052 (insecure / discovery disabled for the example), with a TCP-socket healthcheck. It is wired into the workcell node map in settings.yaml as:
workcell_nodes:
  sila_example: sila://localhost:50052
Trying it out
# Install the experimental SiLA extra
pip install "madsci.client[sila]"

# Connect to the example server (lab must be running: `docker compose up`)
python -c "
from madsci.client.node.sila_node_client import SilaNodeClient
from madsci.common.types.action_types import ActionRequest

client = SilaNodeClient(url='sila://localhost:50052')
info = client.get_info()
print('Actions:', list(info.actions))

result = client.send_action(ActionRequest(
    action_name='ExampleDevice.Greet',
    args={'Name': 'MADSci'},
))
print(result.json_result)
client.close()
"
For an end-to-end walkthrough (introspection, observable polling, binary data, error handling), open examples/notebooks/sila_node_notebook.ipynb. The notebook is also the SiLA validation harness — just validate_nb_sila executes it via papermill against the running compose service.
Stopping the Lab
When finished with the example lab:
# Stop all services (containers remain for restart)
docker compose stop

# Stop and remove all containers
docker compose down

# Stop, remove containers, and delete volumes (complete cleanup)
docker compose down -v --remove-orphans
The lab can be restarted at any time using docker compose up.